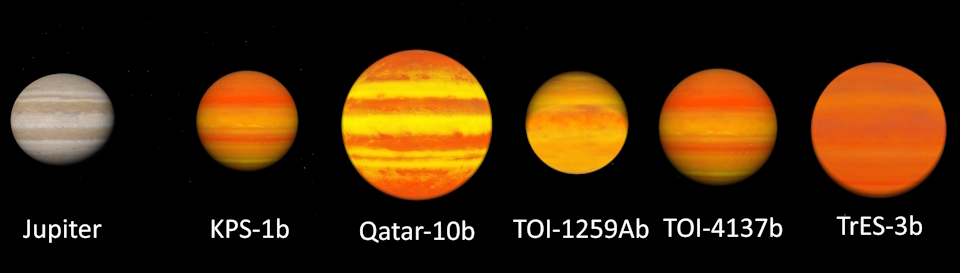
Englisch Article by Dr. Gerold Holtkamp, July 2025
The transit light curves of five exoplanets are evaluated for their reproducibility. The parameters examined are the indirectly measured radius of the respective planet and the temporal center of the transit. After a detailed examination of the individual exoplanets, a summary of the measurements shows that the respective planetary radius was measured reproducibly in 10 of 12 measurements. The temporal centers of the respective transits, however, exhibit greater uncertainties. However, the expected values are also subject to larger errors and are likely subject to future changes. However, 10 of 12 measurements agree with each other.
Introduction
Unusually good weather conditions enabled me to successfully measure 16 transit light curves between March 4, 2025, and May 12, 2025, as evidence of exoplanets. For three of these exoplanets, I was able to measure the light curve twice (on different nights). For the exoplanet TOI-1259Ab, I only measured it once during this time; however, I have two additional measurements for this exoplanet, from 2022 and 2023. There are also two additional transit measurements for the exoplanet TrES-3b, from 2023 and 2024. The question was: Could I prove that my measurements produce reproducible results?
When an exoplanet – as seen from Earth – passes in front of its star, it dims it slightly at regular intervals corresponding to its orbital period. The strength of the dimming is directly dependent on the radius of the exoplanet and its parent star. However, this dimming of the parent star, which is measurable for us on Earth, is often very small and could easily be masked by instrumental effects, atmospheric disturbances, or random fluctuations in the brightness of the star itself. It is therefore important that a transit light curve is observed more than once. Only when the dimming of the transit light curve repeats at the expected times can we say with certainty that it was caused by a real exoplanet. This is why, for example, in the ESA ExoClock project, amateurs are encouraged to measure as many transit light curves as possible. [1] The summary of all these measurements not only shows their reproducibility, but can also significantly increase the accuracy of the determination of the orbital period and size of the exoplanet.
But even for an amateur astronomer like me, it's satisfying to demonstrate the reproducibility of one's own measurement results. Using one's own resources, one can be sure that what one imagines "up there," hundreds of light-years away, actually corresponds to reality.
For the method of measuring the transit light curve to detect an exoplanet, see Wikipedia. [2] The images of the respective star field obtained in one night were usually processed using the Exoclock project's hops software and then sent to the Exoclock project. There, they were analyzed, graphically displayed, and entered into the database.
The graphs show the transit light curve and the temporal position of the transit center. Precise knowledge of the transit center is particularly important for the preparation of ESA's Ariel mission. [3] The dip in the light curve can be used to directly determine the exoplanet's radius.
For an explanation of the individual terms used in the diagrams, see *.
The measurements in detail
Exoplanet KPS-1b
| 8. 3. 2024 Rp/Rs = 0.1147 +/- 0.0043 (expected Exoclock 0.114 +/- 0.004) ->Rp = 72,123 +/- 2,704 km (assumed stellar radius 628,795 km) O-C = -2.07 +/- 1.73 minutes For details: https://kosmos-os.de/messung-der-transitlichtkurven-der-exoplaneten-wasp-84b-und-kps-1b-am-7-und-8-maerz-2024 | 30.4.2025 Rp/Rs = 0,114 +/- 0,005 (expected Exoclock 0.114 +/- 0.004) –> Rp = 71,682 +/- 3,144 km (assumed stellar radius 628,795 km) O-C = -1,00 +/- 1,87 Minuten For details: https://kosmos-os.de/messung-der-transitlichtkurve-des-exoplaneten-kps-1b-am-30-april-1-mai-2025 |
With a brightness of MagR = 12.534 (Exoclock), KPS-1 is already quite dark for the telescope used (10" Newton) and the observation site near the city, which is also reflected in the long exposure times. Therefore, there are relatively few measurement points.
The two measurements are separated by 419 days, corresponding to approximately 246 orbits of KPS-1b around its parent star. Taking the error margins into account, the predicted midpoint of the transit was missed by -0.34 minutes (20 seconds) on March 8, 2025, but was very close on April 30, 2025.
In both cases, the measured value for the reduction of the light curve agreed very well both with the value expected by Exoclock and to each other.
Exoplanet Qatar-10b
| 6.3.2025 Rp/Rs = 0.1316 +/- 0.0024 (expected Exoclock 0.1265 +/- 0.001) ->Rp = 124,078 +/- 2,263 km (assumed stellar radius 942,844 km) O-C = -0.15 +/- 1.18 Minutes For details: https://kosmos-os.de/messung-der-transitlichtkurve-des-exoplaneten-qatar-10b-am-5-6-maerz-2025 | 3.4.2025 Rp/Rs = 0.1241 +/- 0.0034 (expected Exoclock 0.1265 +/- 0.001) -> Rp = 117,007 +/- 3,206 km (assumed stellar radius 942,844 km) O-C = -0.91 +/- 1.87 Minuten For details: https://kosmos-os.de/messung-der-transitlichtkurve-des-exoplaneten-qatar-10b-am-2-3-april-2025 |
With a brightness of MagR = 12.483 (Exoclock), Qatar-10, like KPS-1, is already quite dark for the telescope used (10" Newton) and the observation site near the city. This results in long exposure times.
The two measurements are 30 days apart, corresponding to approximately 18 orbits of Qatar-10b around its parent star. The predicted midpoint of the transit was very accurately determined, taking into account the margins of error, on March 6, 2025, and April 3, 2025.
Although the dip in the light curve was measured too large on March 6, 2025, it was very accurate on April 3, 2025, within the error limits. The measurement on March 6 was also too large compared to the measurement on April 3, even when all error limits were taken into account.
There is another measurement by Thomas Grunge from October 2, 2022. [4]
The result for the exoplanet radius is: Rp = 122,884 +2,936/-3,007 km. Taking all error limits into account, this result fits both of our own measurements on March 6 and April 3, 2025. The exoclock value of the planet's radius (119,270 km) is just about reached, taking the error limits into account.
The deviation from the expected transit center was: O – C = +3.6 minutes (reading it from the diagram is a bit difficult, though).
Exoplanet TOI-1259Ab
| 14.12.2022 Rp/Rs = 0.1506 +/- 0.0013 (Exoclock 0.14762 +/- 0.00035) -> Rp = 74,562 +/- 644 km (assumed stellar radius 495,098 km) O-C = +2.43 +/- 0.58 Minutes For details: https://kosmos-os.de/soeben-entdeckt-exoplanet-toi-1259-a-b | 25.9.2023 Rp/Rs = 0.147 +/- 0.0012 (Exoclock 0.14762 +/- 0.00035) -> Rp = 72,779 +/- 594 km (assumed stellar radius 495,098 km) O-C = -2.1 +/- 1.0 Minutes For details: https://kosmos-os.de/transitkurve-des-exoplaneten-toi-1259-a-b-am-25-26-9-2023 | 18.3.2025 Rp/Rs = 0.1481+/- 0.0021 (Exoclock 0.14762 +/- 0.00035) -> Rp = 73,324 +/- 1,040 km (assumed stellar radius 495,098 km) O-C = -1.7 +/- 0.78 Minutes For details: https://kosmos-os.de/messung-der-transitlichtkurve-des-exoplaneten-toi-1259ab-am-18-maerz-2025 |
The special feature of this system is that it is a binary star system and the exoplanet TOI-1259Ab orbits one of the two components.
With a brightness of MagR = 11.832 (exoclock), TOI-1259Ab is easily observable with the telescope used (10" Newton). This results in exposure times between 30 and 60 s and a large number of measurement points. Furthermore, the relative size of the parent star and planet causes a significant dip in the light curve to 30.65 mmag.
The time interval between the first and last measurements was 825 days, corresponding to approximately 237 orbits of TOI-1259Ab around its primary star. The predicted midpoint of the transit was missed by about two minutes each time, even taking the error margins into account.
The dip in the light curve, i.e., Rp/Rs, was measured on December 14, 2022, slightly too large compared to the expected value specified by Exoclock. The other two measurements fit the expected value and each other very well.
Exoplanet TOI-4137b
| 19.3.2025 Rp/Rs = 0.0855 ± 0.0037 (expected Exoclock 0.0865 +/- 0.008) ->Rp = 85,614 +/- 3,705 km (assumed stellar radius 1,001,337 km) O-C = +7.89 +/- 3.17 Minutes For details: https://kosmos-os.de/messung-der-transitlichtkurve-des-exoplaneten-toi-4137b-am-19-20-maerz-2025 | 7.4.2025 Rp/Rs = 0.086 +/- 0.0047 (expected Exoclock 0.0865 +/- 0.0008) -> Rp = 86,115 +/- 4,707 km (assumed stellar radius 1,001,337 km) O-C = +6.43 +/- 3.6 Minutes For details: https://kosmos-os.de/messung-der-transitlichtkurve-des-exoplaneten-toi-4137b-am-7-8-april-2025 |
With a brightness of MagR = 11.04 (exoclock), TOI-4137b is easy to observe with the telescope used (10" Newtonian), but the relative size of the parent star and planet results in a relatively slight dip in the light curve (8.98 mmag was expected). In both measurements, the Moon was illuminated at 74% and 78%, respectively, which may have negatively impacted the quality of the measurements. Both measurements are quite noisy.
In both measurements, the ratio Rp/Rs and thus the radius of the exoplanet agree well with the value expected by Exoclock and also with each other.
The two measurements are separated by 19 days, corresponding to five orbits of TOI-4137b around its primary star. The predicted midpoint of the transit deviates significantly (positively) from the expected value, even taking the margins of error into account. However, this also applies to the majority of other measurements available on Exoclock. It remains to be seen how the situation will unfold with further measurements.
Exoplanet TrES-3b
| 27.5.2023 Rp/Rs = 0.1573 ± 0.006 (expected Exoclock 0.17 +/- 0.03) ->Rp = 89,051 +/- 3,397 km (assumed stellar radius 566,124 km) O-C = +0.36 +/- 1.3 Minutes For details: https://kosmos-os.de/messung-der-transitkurve-des-exoplaneten-tres-3-b-am-27-5-2023 | 18.7.2024 Rp/Rs = 0.1651 ± 0.0028 (expected Exoclock 0.17 +/- 0.03) -> Rp = 93,467 +/- 1,585 km (assumed stellar radius 566,124 km) O-C = +0.62 +/- 0.58 Minutes For details: https://kosmos-os.de/tres-3b-hat-p-18b-toi-2154b-und-toi-1251-01 |
With a brightness of MagR = 12.06 (Exoclock), TrES-3b is still easily observable with the telescope used (10" Newton), as an obscuration of approximately 28 mmag is expected. Since Exoclock indicates a rather large error in the expected value of Rp/Rs, both of our measurements agree with this within the error limits. The measurements also agree with each other, taking the errors into account.
The two measurements are separated by 419 days, corresponding to 321 orbits of TrES-3b around its primary star. The predicted midpoint of the transit is very well confirmed by both of our own measurements.
Summary of measurements
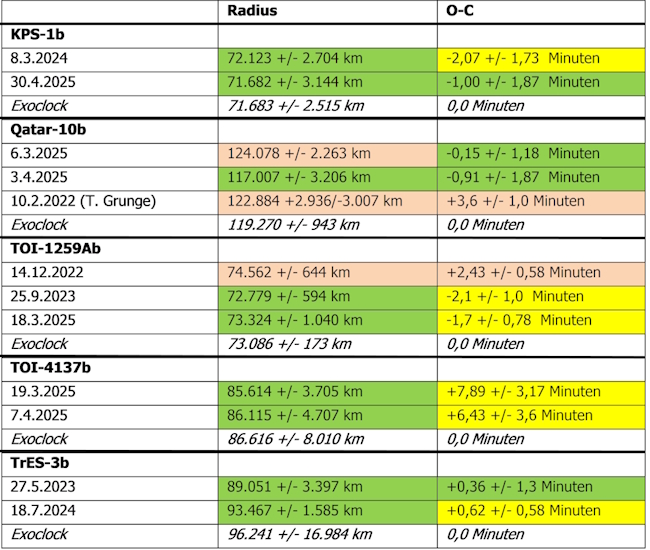
The values highlighted in green are reproduced results that agree with the Exoclock expected value. Own values that at least agree with each other are highlighted in yellow. Values highlighted in red indicate no agreement.
Reproducible radii results were obtained for the exoplanets KPS-1b, TOI-4137b, and TrES-3b. For the radius of Qatar-10b, the exoclock expected value was only met in one of three measurements. For TOI-1259b, two of three measurements were successful.
When determining the transit's midpoint, only four of the twelve measurements examined agreed with the Exoclock expected value. However, six other measurements at least agreed with each other. Two measurements did not reach the expected value. Regarding the expected value of the transit's midpoint, however, it should be noted that it is still subject to change if a large number of measurements indicate a different, more realistic value. There is also the possibility that the large number of measurements could result in a different value. After all, determining this is the core task of the Exoclock project.
_____________________________________________________________________________
*
Explanation of the individual terms used in the diagrams:
Rp/Rs
The ratio of exoplanet radius to stellar radius (Rp/Rs) results directly from the magnitude of the dip in the light curve. (see also https://kosmos-os.de/messung-der-transitlichtkurven-der-exoplaneten-wasp-84b-und-kps-1b-am-7-und-8-maerz-2024)
When considering the literature's values for Rp and Rs, which are usually based on the radius of Jupiter and the radius of the Sun, respectively, it is important to note that both are oblate. Therefore, the pole-to-pole and equatorial diameters are different.
Phase
The phase is a value between 0 and 1 that indicates how far along the planet's orbit relative to the center of the transit. Its total orbital period is therefore normalized to 1.
O – C
The deviation of the transit's time center from the Exoclock calculated/expected O – C (Observed – Calculated) in minutes is shown together with the other measurements at Exoclock.
Epoch
Indicates the number of orbits of the exoplanet from a specified point in time (epoch=0). (see https://www.exoclock.space/database/planets/“Planetenname“/ under “Mid-time”)
_____________________________________________________________________________
[1] https://www.exoclock.space/
[2] https://de.wikipedia.org/wiki/Transitmethode
[3] https://www.esa.int/Science_Exploration/Space_Science/Ariel