– Measurement accuracy and errors that can be avoided –
Dr. Gerold Holtkamp, October 4, 2023
Aktualisierung am 10.2.20226 [8]
The transit of the exoplanet TOI-1259 A b in front of its parent star, which is a component of a binary star system, is shown. The light curve recorded agrees well with the measurements of other authors. A detailed error analysis provides information on how to further improve this sensitive measurement method.
Again another transit light curve of the exoplanet TOI-1259 A b, when one was measured by the same author less than a year ago and also published here [1]? Some readers will ask themselves this. That's true, but ...
To find out more about a star, astronomers have come up with a lot of ideas. Exoplanets have been detectable since around 1990, among other things. with the so-called transit method. The great thing is that this method is also accessible to amateurs. Such transit light curves are collected by amateurs worldwide in various databases. And the crowd does it! Even if the amateur measurements are perhaps more error-prone than those of the professionals with their expensive earth-based or even satellite-based devices, there is a lot of data from the amateurs that is much cheaper (at least from a professional perspective). The professionals have long since recognized this. That's why there are various databases or initiatives that collect this data (ETD [2], AAVSO [3], Exoclock [4]). This so-called citizen science contributes to more precise research into exoplanets. For example, you can definitely see changes in the data collections for individual objects over the years (see below occultation period of the exoplanet TOI-1259 A b). On the one hand, the information on the individual exoplanets is becoming more and more precise as the number of measurements increases. On the other hand, one is also looking for so-called transit timing variations, i.e. changes in the transit duration of a planet, which can provide an indication of other not yet known planets in the respective system.
The exoplanet TOI-1259 A b
For a more detailed description of the exoplanet TOI-1259 A b, please see the report dated December 14, 2022. [1] In addition to the reasons given there why this observation object is interesting, the following can be mentioned:
1. The parent star is part of a binary star system. The main star TOI-1259 A, around which the exoplanet orbits, has the stellar companion TOI-1259 B, which is gravitationally bound to the main star at about 1,600 AU (0.025 Ly). To us on Earth it appears about 19 mag bright. An exoplanet in a binary star system is - so far - something special, but obviously possible. In this case the planet orbits around the main component. However, systems have also been found in which the exoplanet orbits around the two closely bound stars.
2. The brightness of the parent star TOI-1259 A makes it a suitable candidate for satellite-based spectroscopic studies of the exoplanet's atmosphere. The aim here is to take advantage of the fact that parts of the light from the parent star pass through the edge areas of the planet's atmosphere during transit and are thereby characteristically changed by the elements present there. However, only a fraction of the total light from the star that reaches us is changed. So you need very sensitive, low-interference methods for analysis, which so far have only been available with devices in space. TOI-1259 A b is listed in the so-called Ariel Mission Reference Sample [5]. Ariel is a European probe planned for 2029 to study exoplanet atmospheres [6]. The Exoclock project was created specifically to collect accurate data on exoplanets collected by amateurs around the world.
Of course, the James Webb telescope should also be mentioned here, which is particularly suitable for exactly this task.
The Measurement
The measurement setup on September 25th - 26th, 2023 was the same as on December 14th, 2022. There is one difference, however: Instead of a guidescope, an off-axis guider was now used, which was supposed to enable significantly better fine tracking, which it actually did. Symbol „Von der Community überprüft“
Recordings were made:
- 304 lights with 45 s each (22:30 to 3:09 UTC)
- 10 Darks
- 10 Flats
The settings were Gain 60, Bias 20 and the temperature of the recording chip -10° C. The star brightness was checked using AstroArt 8 and the recordings were evaluated using MuniWin 2.1.
The results
As with several other projects in the past, the measured values were again submitted to the ETD – Exoplanet Transit Database of the Czech Astronomical Society. Here you don't just get an analysis of the data. They are also added to their database after a quality check and are therefore accessible to everyone. They are listed in the table below.
| Own values in ETD 25.9.2023 | Own values in ETD December 14, 2022 | ETD 2023 | ETD 2022 | Transit Finder 2023 | Transit Finder 2022 | |
| JD mid | 2460213.53105 +/- 0.00045 | 0:46 UTC | ||||
| HJD mid | 2460213.53134 +/- 0.00045 | 2460213.533 | ||||
| Duration | 144.3 +/- 1.6 | 141.0 +/- 1.6 | 148 | 148 | 151 | 140 |
| Depth | 0.0313 +/- 0.0007 | 0.0288 +/- 0.0012 | 0.0287 | 0.02702 | 0.029 |
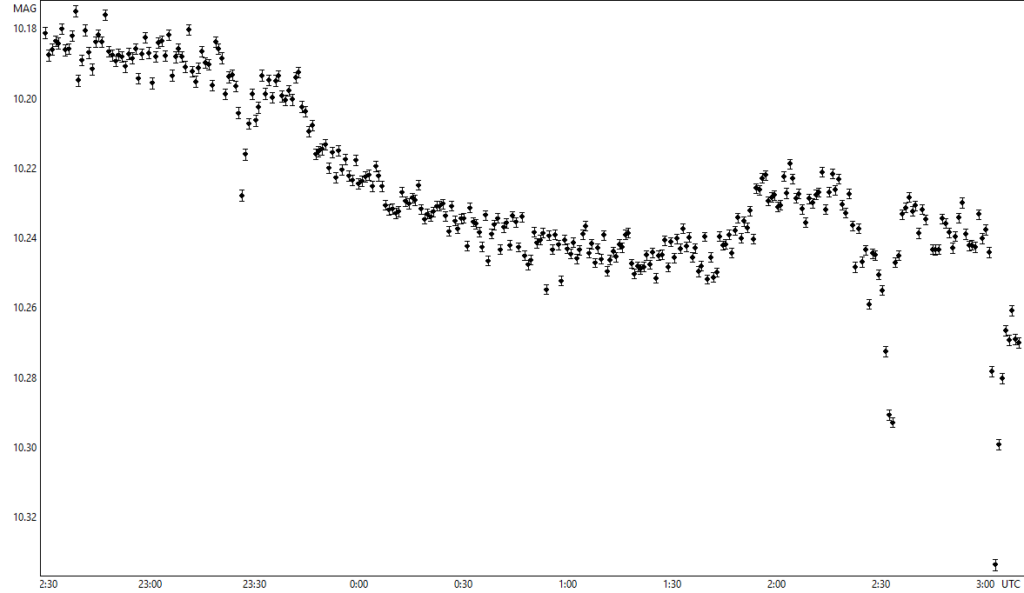
One can see that the Transit Finder specifications have changed from 2022 to 2023. This is an indication that this system is still worth “taking a closer look at”. The light curve and the position of your own values in comparison to the other measurements in ETD are shown below.

The transit of the exoplanet is clearly visible. Already at this point the transit duration could be estimated at around 144 minutes and the transit depth at around 0.030 mag.

The entry of your own measurement in this diagram shows an upward deviation from the predicted value, i.e. a greater darkening. It remains to be seen how the values will develop in the future.

The entry of your own measurement in this diagram shows - as with the measurements of most other authors - a deviation from the predicted value, but downwards, i.e. with shorter transit times. Here too, it remains to be seen how the values will develop in the future.

This diagram shows the deviation of the measurement data from the fitted curve (Observed – Calculated). Based on our own values, it was obviously possible to create a compensation curve in the expected form sufficiently well.
Errors (and how to avoid them)
Sky Brightness
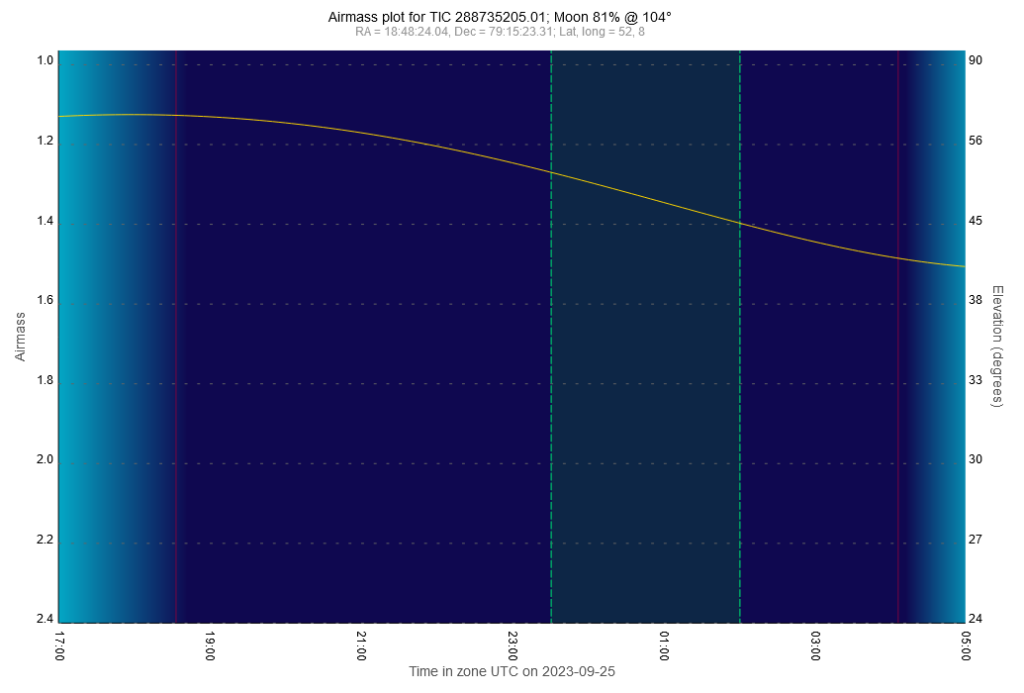
The observation site is in the city of Osnabrück. That cannot be changed. However, the observation object was in the north, so the viewing direction was away from the city center. That was better because the city center wasn't lit up there. However, the moon was 83% illuminated in the sky, but 103° away from the observed object. So it couldn't shine into the telescope. At the start of the measurement it was 10° above the horizon. Moonset was on September 26, 2023 in the morning at 2:26 CEST (0:26 UTC). The influence of the moon on the sky brightness can be clearly seen in the following diagram of the sky brightness from the MuniWin evaluation. The decrease in brightness is caused by the setting moon. The increase in brightness after 2:00 UTC can be explained by the lower height of the observed object above the horizon from this point onwards (see Airmass diagram). Astronomical twilight began on September 26, 2023 at 5:24 a.m. CEST (3:24 UTC), so it had no influence on the sky brightness during the measurement.
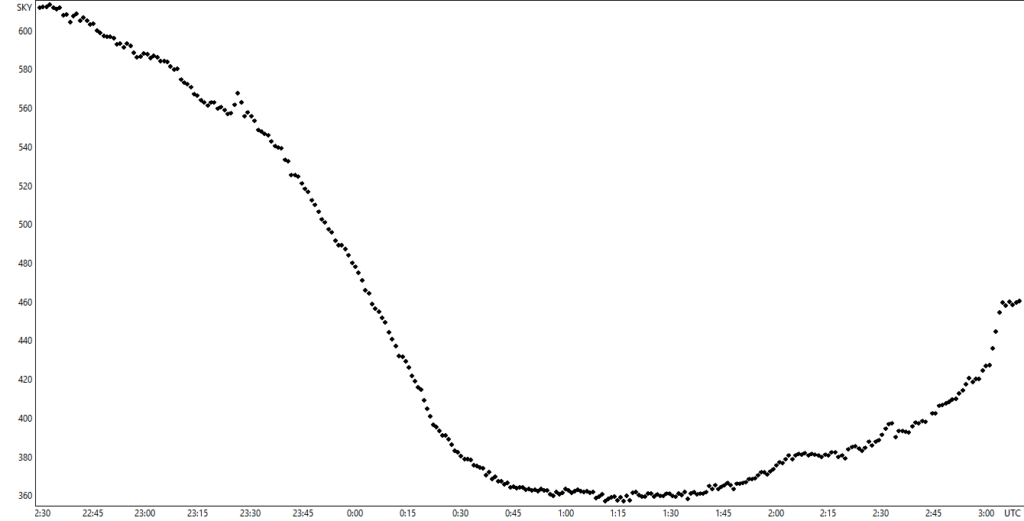
Sky brightness in ADU/pixel vs time in UTC (MuniWin)
Position change of the star's light spot on the chip
The individual pixels of the camera chip have different detection sensitivities, i.e. the yield of electrons per quantum of light is slightly different. The optimum positioning accuracy of the telescope would be achieved if the same pixels were always illuminated by the star spot. The flatfield recordings compensate for most of these irregularities (of course also the vignetting, dirt on the optics and other imaging errors), but there remains an unpredictable influence.

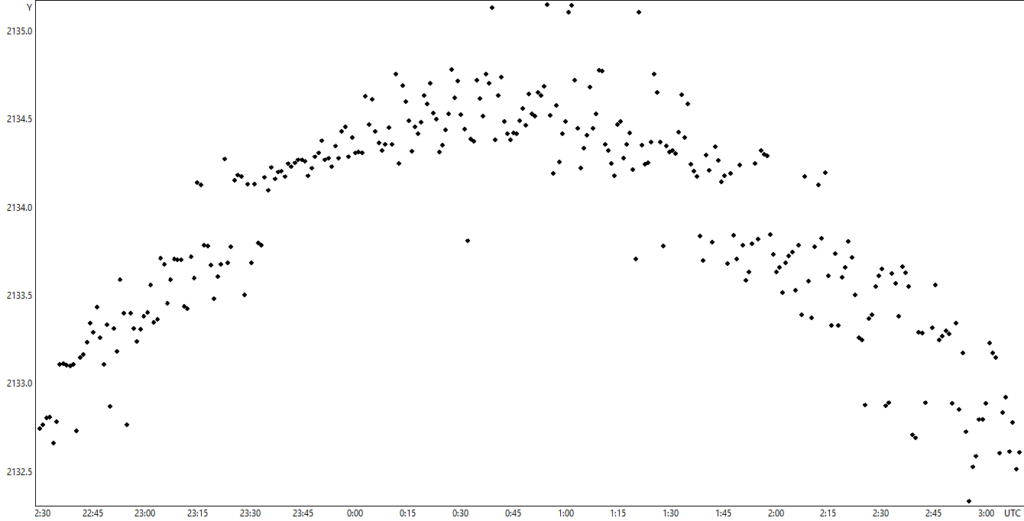
Despite using the off-axis guider, the light spot of the target star moves across the chip, less in the Y direction (perpendicular to the optical axis of the main mirror), but particularly strongly in the X direction (parallel to the optical axis of the main mirror). The cause is not entirely clear, as the guider absorbs some of the same rays as the main camera chip. Cables that are attached too loosely may be pulling on the guide camera, whose position changed by almost 90° relative to the ground during the measurement.
Size of the star spot on the chip
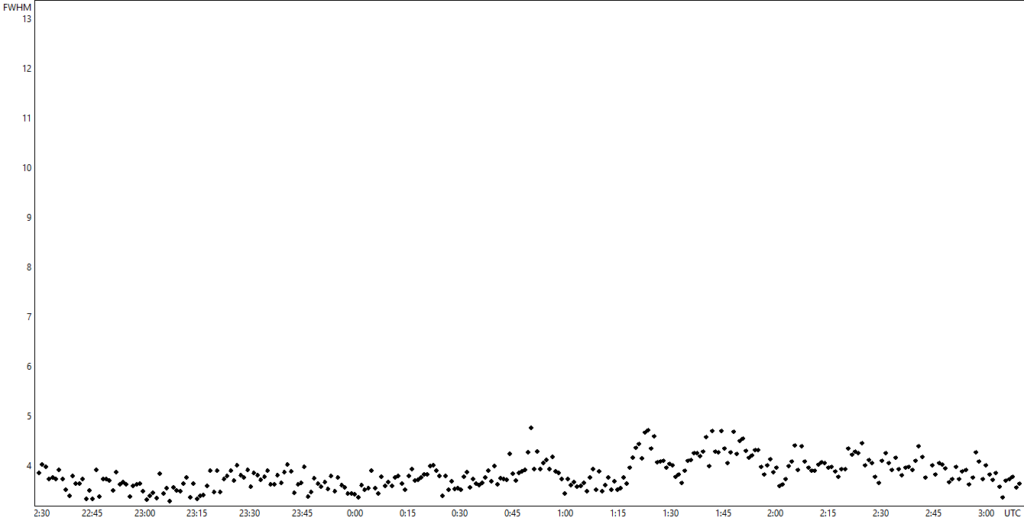
The size of the target star's light spot fluctuates somewhat and increases slightly in the second half of the measurement period, but is unlikely to have significantly influenced the evaluation by MuniWin.
Chip temperature stability
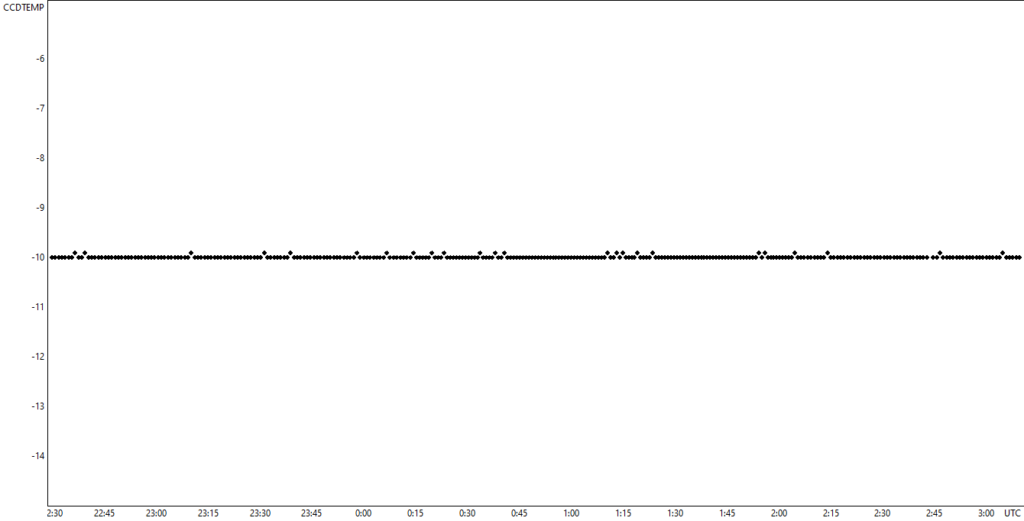
The chip temperature remained very stable during the measurement period.
The illumination of the pixels of the respective star
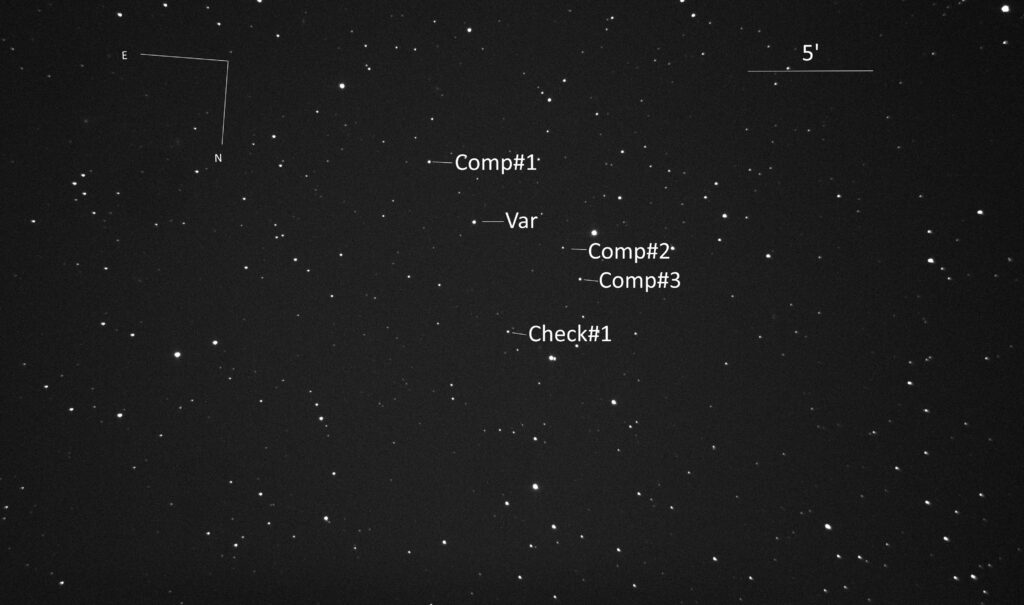
It is important that the main camera worked in the linear range, meaning that no pixels of the relevant stars were overexposed. The comparison stars used are relatively poorly exposed, but they are close to the target star. A comparison with better exposed stars further away did not result in any improvement in the transit light curve. The advantage of better exposure is probably offset by the disadvantages of the greater distance from the target star (e.g. different atmospheric disturbances). The light spots appear elliptical because AstroArt renders the pixels rectangular and not square. So they were actually round.

Light curve without comparison stars
The light curve without comparison stars already shows the decline, albeit with a strong trend and some downward outliers, which may be due to passing veil clouds. This would of course be counteracted by comparison stars. However, the transit duration and the lowering of the light curve have to be determined very precisely.
Evaluation
Ther own values agree with the other measured for both the transit duration and the transit depth. A systematic change in transit duration in the sense of transit timing variations cannot or cannot yet be determined. There are still too few measurements available for this. It will be interesting to follow the further development of the measured data, especially with regard to possible use in the satellite-based study of the atmosphere of TOI-1259 A b by the JWST and the planned ESA mission Ariel.
The final assessment and thus the transfer of the data by ETD into the database are still pending at the time of publication of this report. However, the diagrams shown were created automatically in advance by ETD.
The data was also made available to the AAVSO – American Association of Variable Star Observers exoplanet database. All of our own transit light curves, including those of other exoplanets, can be found at [7].
___________________________________________________________________________
[1] https://kosmos-os.de/soeben-entdeckt-exoplanet-toi-1259-a-b
[3] https://www.aavso.org/databases
[4] https://www.exoclock.space/
[5] The Astronomical Journal, 164:15 (25pp), 2022 July, https://doi.org/10.3847/1538-3881/ac6bf9
[6] Experimental Astronomy (2018) 46:135–209, https://doi.org/10.1007/s10686-018-9598-x
[8] Aktualisierung am 10.2.2026
Die gemessene Transitlichtkurve wurde in folgende Veröffentlichung aufgenommen:
A. Kokori, A. Tsiaras, G. Pantelidou et al. (2025).
ExoClock Project IV: A homogeneous catalogue of 620 updated exoplanet ephemerides.
The Astrophysical Journal Supplement Series (submitted)